
Distribution Frequency
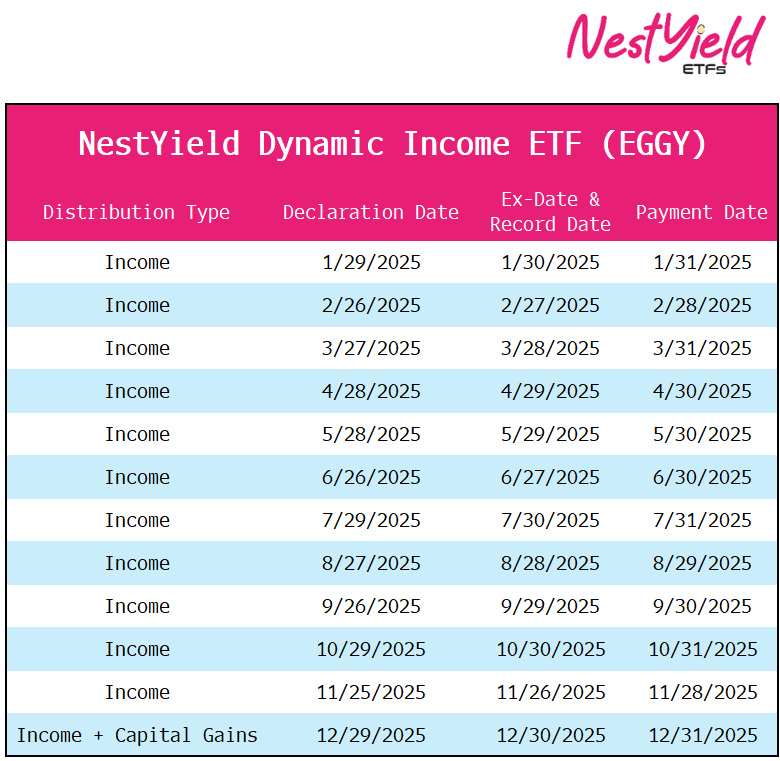
Monthly
Expense Ratio
0.95%
Distribution Rate
32.69%
30-Day SEC Yield
-0.41%
Inception
NAV
51.41%
Market Price
52.32%
1YR
NAV
47.81%
Market Price
48.42%
EGGY is built for investors seeking high monthly income without sacrificing long-term growth potential. Actively managed and strategically focused, EGGY targets an average annual yield of 25%, through a selective covered call strategy applied to a concentrated portfolio of 10 to 25 of NestYield’s highest-conviction holdings.
While EGGY’s primary objective is income generation, the fund may also employ targeted downside hedge on select positions when market conditions warrant — helping to safeguard returns without sacrificing meaningful upside.
EGGY
Distributions made by the Funds have been classified as a return of capital and may be comprised of option premiums, dividends, capital gains, and interest payments. As of May 29, 2026 recent distributions by the funds, the distribution composition for each fund was estimated to be return of capital in the following amounts. EGGQ = 0.00%, EGGY = 0.00%, EGGS = 0.00%. Please see the 19a-1 notices for a more comprehensive breakdown of monthly distributions on each Fund’s page.
The Distribution Rate is the annual rate an investor would receive if the most recently declared distribution remained the same going forward. The Distribution Rate is calculated by multiplying an ETF’s Distribution per Share by twelve (12) and dividing the resulting amount by the ETF’s most recent NAV. The Distribution Rate represents a single distribution from the ETF and does not represent its total return. Distributions are not guaranteed.
Performance
| Name |
|---|
| 5/31/2026 |
| Fund Name | Fund Ticker | 1 Month | 3 Month | 6 Month | YTD | 1 Year | 3 Year | 5 Year | 10 Year | Since Inception (Cumulative) | Since Inception (Annualized) | Date |
|---|---|---|---|---|---|---|---|---|---|---|---|---|
| NestYield Dynamic Income ETF | EGGY MKT | 13.56 | 32.06 | 32.29 | 33.52 | 48.42 | - | - | - | 52.32 | 34.28 | 05/31/2026 |
| NestYield Dynamic Income ETF | EGGY NAV | 12.96 | 31.43 | 31.46 | 32.76 | 47.81 | - | - | - | 51.41 | 33.73 | 05/31/2026 |
| S&P 500 TR | SPTR2 | 5.26 | 10.52 | 11.34 | 11.27 | 29.78 | - | - | - | 27.80 | 18.75 | 05/31/2026 |
| Name |
|---|
| 3/31/2026 |
| Fund Name | Fund Ticker | 1 Month | 3 Month | 6 Month | YTD | 1 Year | 3 Year | 5 Year | 10 Year | Since Inception (Cumulative) | Since Inception (Annualized) | Date |
|---|---|---|---|---|---|---|---|---|---|---|---|---|
| NestYield Dynamic Income ETF | EGGY MKT | -6.2 | -5.16 | -10.65 | -5.16 | 21.56 | - | - | - | 8.19 | 6.45 | 03/31/2026 |
| NestYield Dynamic Income ETF | EGGY NAV | -5.94 | -4.99 | -10.52 | -4.99 | 21.92 | - | - | - | 8.36 | 6.58 | 03/31/2026 |
| S&P 500 TR | SPTR2 | -4.98 | -4.33 | -1.79 | -4.33 | 17.8 | - | - | - | 9.88 | 7.76 | 03/31/2026 |
Performance data quoted represents past performance and is no guarantee of future results. Investment return and principal value of an investment will fluctuate so that an investor’s shares, when redeemed, may be worth more or less than their original cost. Current performance may be lower or higher than the performance data quoted. For the most recent month-end performance, please call 855-879-5979.
Short term performance, in particular, is not a good indication of the fund’s future performance, and an investment should not be made based solely on historical returns. Returns beyond 1 year are annualized.
A fund’s NAV is the sum of all its assets less any liabilities, divided by the number of shares outstanding. The market price is the most recent price at which the fund was traded.
FUND DETAILS
| Name | Value |
|---|---|
| Fund Inception | 12/26/2024 |
| Ticker | EGGY |
| Primary Exchange | NYSE |
| CUSIP | 45259A787 |
| Expense Ratio | 0.95% |
| 30 Day SEC Yield* As of 05/31/2026 | -0.41% |
*The 30-Day SEC Yield is calculated with a standardized formula mandated by the SEC. The formula is based on the maximum offering price per share and does not reflect waivers in effect.
| Name | Value |
|---|---|
| Net Assets | $134.40m |
| NAV | $41.67 |
| Shares Outstanding | 3,225,000 |
| Premium/Discount Percentage | 0.16% |
| Closing Price | $41.74 |
| Median 30 Day Spread* | 0.32% |
| Name |
|---|
| 06/04/2026 |
*30-Day Median Spread is a calculation of Fund’s median bid-ask spread, expressed as a percentage rounded to the nearest hundredth, computed by: identifying the Fund’s national best bid and national best offer as of the end of each 10 second interval during each trading day of the last 30 calendar days; dividing the difference between each such bid and offer by the midpoint of the national best bid and national best offer; and identifying the median of those values.
Distribution Detail
| EX Date | Record Date | Payable Date | Fund Total |
|---|---|---|---|
| 05/28/2026 | 05/28/2026 | 05/29/2026 | 1.10 |
| 04/29/2026 | 04/29/2026 | 04/30/2026 | 1.00 |
| 03/30/2026 | 03/30/2026 | 03/31/2026 | 1.00 |
| 02/26/2026 | 02/26/2026 | 02/27/2026 | 1.00 |
| 01/29/2026 | 01/29/2026 | 01/30/2026 | 0.87 |
| 12/30/2025 | 12/30/2025 | 12/31/2025 | 0.87 |
| 11/26/2025 | 11/26/2025 | 11/28/2025 | 0.87 |
| 10/30/2025 | 10/30/2025 | 10/31/2025 | 0.87 |
| 09/29/2025 | 09/29/2025 | 09/30/2025 | 0.83 |
| 08/28/2025 | 08/28/2025 | 08/29/2025 | 0.81 |
| 07/30/2025 | 07/30/2025 | 07/31/2025 | 0.83 |
| 06/27/2025 | 06/27/2025 | 06/30/2025 | 0.82 |
| 05/29/2025 | 05/29/2025 | 05/30/2025 | 0.78 |
| 04/29/2025 | 04/29/2025 | 04/30/2025 | 0.73 |
| 03/28/2025 | 03/28/2025 | 03/31/2025 | 0.73 |
| 02/27/2025 | 02/27/2025 | 02/28/2025 | 0.95 |
| 01/30/2025 | 01/30/2025 | 01/31/2025 | 0.83 |
Top 10 Holdings
| Name |
|---|
| 06/05/2026 |
| Date | Account | StockTicker | CUSIP | SecurityName | Shares | Price | MarketValue | Weightings | NetAssets | SharesOutstanding | CreationUnits |
|---|---|---|---|---|---|---|---|---|---|---|---|
| 06/05/2026 | EGGY | STX | G7997R103 | Seagate Technology Holdings PLC | 15919 | 925.99 | 14740834.81 | 11.05 | 133353920 | 3200000 | 128 |
| 06/05/2026 | EGGY | FGXXX | 31846V336 | First American Government Obligations Fund 12/01/2031 | 13985963 | 100 | 13985963.46 | 10.49 | 133353920 | 3200000 | 128 |
| 06/05/2026 | EGGY | BE | 093712107 | Bloom Energy Corp | 43013 | 291.37 | 12532697.81 | 9.40 | 133353920 | 3200000 | 128 |
| 06/05/2026 | EGGY | MU | 595112103 | Micron Technology Inc | 9309 | 996 | 9271764 | 6.95 | 133353920 | 3200000 | 128 |
| 06/05/2026 | EGGY | LITE | 55024U109 | Lumentum Holdings Inc | 9130 | 945.08 | 8628580.4 | 6.47 | 133353920 | 3200000 | 128 |
| 06/05/2026 | EGGY | COHR | 19247G107 | Coherent Corp | 18293 | 421.9 | 7717816.7 | 5.79 | 133353920 | 3200000 | 128 |
| 06/05/2026 | EGGY | VRT | 92537N108 | Vertiv Holdings Co | 20178 | 323.92 | 6536057.76 | 4.90 | 133353920 | 3200000 | 128 |
| 06/05/2026 | EGGY | AMD | 007903107 | Advanced Micro Devices Inc | 10720 | 523.2 | 5608704 | 4.21 | 133353920 | 3200000 | 128 |
| 06/05/2026 | EGGY | WDC | 958102105 | Western Digital Corp | 9130 | 575.35 | 5252945.5 | 3.94 | 133353920 | 3200000 | 128 |
| 06/05/2026 | EGGY | GOOGL | 02079K305 | Alphabet Inc | 14014 | 372.19 | 5215870.66 | 3.91 | 133353920 | 3200000 | 128 |
| 06/05/2026 | EGGY | Cash&Other | Cash&Other | Cash & Other | 5111410 | 1 | 5111409.71 | 3.83 | 133353920 | 3200000 | 128 |
| 06/05/2026 | EGGY | CRDO | G25457105 | Credo Technology Group Holding Ltd | 23090 | 217.5 | 5022075 | 3.77 | 133353920 | 3200000 | 128 |
| 06/05/2026 | EGGY | TER | 880770102 | Teradyne Inc | 11916 | 406.86 | 4848143.76 | 3.64 | 133353920 | 3200000 | 128 |
| 06/05/2026 | EGGY | LLY | 532457108 | Eli Lilly & Co | 4132 | 1125.27 | 4649615.64 | 3.49 | 133353920 | 3200000 | 128 |
| 06/05/2026 | EGGY | VST | 92840M102 | Vistra Corp | 29586 | 153.7 | 4547368.2 | 3.41 | 133353920 | 3200000 | 128 |
| 06/05/2026 | EGGY | TSM | 874039100 | Taiwan Semiconductor Manufacturing Co Ltd | 9917 | 444.92 | 4412271.64 | 3.31 | 133353920 | 3200000 | 128 |
| 06/05/2026 | EGGY | ALAB | 04626A103 | Astera Labs Inc | 11620 | 358.05 | 4160541 | 3.12 | 133353920 | 3200000 | 128 |
| 06/05/2026 | EGGY | CLS | 15101Q207 | Celestica Inc | 9389 | 425.36 | 3993705.04 | 2.99 | 133353920 | 3200000 | 128 |
| 06/05/2026 | EGGY | CIEN | 171779309 | Ciena Corp | 7352 | 535.63 | 3937951.76 | 2.95 | 133353920 | 3200000 | 128 |
| 06/05/2026 | EGGY | CRWV | 21873S108 | CoreWeave Inc | 26824 | 108.03 | 2897796.72 | 2.17 | 133353920 | 3200000 | 128 |
| 06/05/2026 | EGGY | SNDK 260618C01830000 | SNDK 260618C01830000 | SNDK US 06/18/26 C1830 | 95 | 111.15 | 1055925 | 0.79 | 133353920 | 3200000 | 128 |
| 06/05/2026 | EGGY | ASTS 260702C00134000 | ASTS 260702C00134000 | ASTS US 07/02/26 C134 | 1200 | 6.575 | 789000 | 0.59 | 133353920 | 3200000 | 128 |
| 06/05/2026 | EGGY | AAOI 260710C00240000 | AAOI 260710C00240000 | AAOI US 07/10/26 C240 | 350 | 22.35 | 782250 | 0.59 | 133353920 | 3200000 | 128 |
| 06/05/2026 | EGGY | LITE 260612C00975000 | LITE 260612C00975000 | LITE US 06/12/26 C975 | 50 | 41.65 | 208250 | 0.16 | 133353920 | 3200000 | 128 |
| 06/05/2026 | EGGY | IREN 260612C00065000 | IREN 260612C00065000 | IREN US 06/12/26 C65 | 750 | 2.805 | 210375 | 0.16 | 133353920 | 3200000 | 128 |
| 06/05/2026 | EGGY | COHR 260605C00397500 | COHR 260605C00397500 | COHR US 06/05/26 C397.5 | 17 | 27.55 | 46835 | 0.04 | 133353920 | 3200000 | 128 |
| 06/05/2026 | EGGY | LITE 260605C00920000 | LITE 260605C00920000 | LITE US 06/05/26 C920 | 8 | 36 | 28800 | 0.02 | 133353920 | 3200000 | 128 |
| 06/05/2026 | EGGY | LITE 260612C01075000 | LITE 260612C01075000 | LITE US 06/12/26 C1075 | -50 | 14.45 | -72250 | -0.05 | 133353920 | 3200000 | 128 |
| 06/05/2026 | EGGY | IREN 260612C00072000 | IREN 260612C00072000 | IREN US 06/12/26 C72 | -750 | 1.145 | -85875 | -0.06 | 133353920 | 3200000 | 128 |
| 06/05/2026 | EGGY | LITE 260605C00745000 | LITE 260605C00745000 | LITE US 06/05/26 C745 | -8 | 201.35 | -161080 | -0.12 | 133353920 | 3200000 | 128 |
| 06/05/2026 | EGGY | COHR 260605C00322500 | COHR 260605C00322500 | COHR US 06/05/26 C322.5 | -17 | 100.1 | -170170 | -0.13 | 133353920 | 3200000 | 128 |
| 06/05/2026 | EGGY | ASTS 260702C00138000 | ASTS 260702C00138000 | ASTS US 07/02/26 C138 | -1200 | 5.775 | -693000 | -0.52 | 133353920 | 3200000 | 128 |
| 06/05/2026 | EGGY | AAOI 260710C00245000 | AAOI 260710C00245000 | AAOI US 07/10/26 C245 | -350 | 21 | -735000 | -0.55 | 133353920 | 3200000 | 128 |
| 06/05/2026 | EGGY | SNDK 260618C01870000 | SNDK 260618C01870000 | SNDK US 06/18/26 C1870 | -95 | 97.7 | -928150 | -0.70 | 133353920 | 3200000 | 128 |
Holdings are subject to change without notice.
NestYield ETFs

Income Strategy Built to Manage Risk.
An investment approach designed for investors seeking income with a focus on risk management in changing market conditions.

Invest in Tomorrow. Lead with Innovation.
NestYield Visionary ETF (EGGQ) invests in innovation and technology companies driving growth potential. For investors seeking to capitalize on visionary opportunities

Built on insight. Invest with care.
NestYield Total Return Guard ETF (EGGS) invests in U.S. large-cap innovators, using active management and options strategies to seek income, manage risk, and hedge downturns.
Buy EGGY
NestYield™ ETFs are available through various channels including broker-dealers, investment advisers, and other financial services firms, including:
An investor should consider the investment objectives, risks, charges, and expenses of the Fund carefully before investing. To obtain a prospectus or summary prospectus containing this and other information, please email us at info@nestyield.com Read the prospectus carefully before investing.
Diversification does not assure a profit or protect against loss in a declining market.
NestYield ETF Risks – Investing in NestYield ETFs involves risk, including the potential loss of principal. Although the Funds are diversified, they are subject to risks, including those associated with market volatility, changes in economic conditions, and fluctuations in portfolio securities’ value. Investments in derivatives, such as futures and swaps, may pose additional risks, including imperfect correlations, increased price volatility, and potential liquidity challenges. These factors may cause the value of the Funds to change quickly and unpredictably. Please review the summary and full prospectuses for a comprehensive description of these and other risks.
Derivatives Risk. Derivatives are financial instruments that derive value from the underlying reference asset or assets, such as stocks, bonds, or funds (including ETFs), interest rates or indexes. The Fund’s investments in derivatives may pose risks in addition to, and greater than, those associated with directly investing in securities or other ordinary investments, including risk related to the market, imperfect correlation with underlying investments or the Fund’s other portfolio holdings, higher price volatility, lack of availability, counterparty risk, liquidity, valuation and legal restrictions. The use of derivatives may result in larger losses or smaller gains than directly investing in securities.
Options Contracts. The use of options contracts involves investment strategies and risks different from those associated with ordinary portfolio securities transactions. The prices of options are volatile and are influenced by, among other things, actual and anticipated changes in the value of the underlying instrument, including the anticipated volatility, which are affected by fiscal and monetary policies and by national and international political, changes in the actual or implied volatility or the reference asset, the time remaining until the expiration of the option contract and economic events.
Counterparty Risk. The Fund is subject to counterparty risk by virtue of its investments in options contracts. Ýistribution Risk. As part of the Fund’s investment objective, the Fund seeks to provide current monthly income. There is no assurance that the Fund will make a distribution in any given month.
Focused Portfolio Risk. The Fund will hold a relatively focused portfolio that may contain exposure to the securities of fewer issuers than the portfolios of other ETFs. Holding a relatively concentrated portfolio may increase the risk that the value of the Fund could go down because of the poor performance of one or a few investments.
Management Risk. The Fund is subject to management risk because it is an actively managed portfolio. The Fund’s sub-advisers will apply investment techniques and risk analyses in making investment decisions for the Fund, but there can be no guarantee that the Fund will meet its investment objective.
New Fund Risk. The Fund is a recently organized management investment company with no operating history. As a result, prospective investors do not have a track record or history on which to base their investment decisions.
Distribution Risk. As part of the Fund’s investment objective, the Fund seeks to provide current income on a monthly or more frequent basis. There is no assurance that the Fund will make a distribution in any given week or month. If the Fund does make distributions, the amounts of such distributions will likely vary greatly from one distribution to the next. Additionally, monthly or more frequent distributions, if any, may consist of returns of capital, which would decrease the Fund’s NAV and trading price over time. As a result, an investor may suffer significant losses to their investment.
Call option is a financial contract that gives you the right, but not the obligation, to buy a stock (or other asset) at a specific price (called the strike price) within a certain period of time.
Call spread is an options strategy involving the buying and selling of call options on the same underlying asset with different strike prices but the same expiration date.
Covered call is an options strategy where you sell a call option on a stock that you already own
Out of the money (OTM) cover call is an options strategy where you own a stock and sell a call option on that stock with a strike price above the current market price.
Options spread is a strategy that involves buying and selling multiple options on the same underlying asset, but with different strike prices and/or expiration dates
Long put option is a strategy used by investors who expect the price of a stock to fall.
Buy a Put Option: You purchase a put option, which gives you the right (but not the obligation) to sell a stock at a specific price (the strike price) before a certain date (the expiration date).
Cost: You pay a premium (fee) to buy the put option.
Profit from Price Drop: If the stock’s price falls below the strike price, you can sell the stock at the higher strike price, which can be profitable after accounting for the premium paid.
Loss: If the stock’s price does not fall below the strike price before the expiration date, you only lose the premium you paid for the option.
Distributor: Foreside Fund Services, LLC. Foreside Fund Services, LLC and Nest Egg ETFs, LLC., dba NestYield ETFs are unaffiliated.
Distribution Details